If you're running Google or Meta ads, the dashboard leads with cost per click, and it's the number that gets reported with the most pride. It's cheap to improve and easy to celebrate. It also tells you almost nothing about whether the campaign made you money.
The gap between cost per click and cost per sale is where I watch budgets quietly leak.
The leak
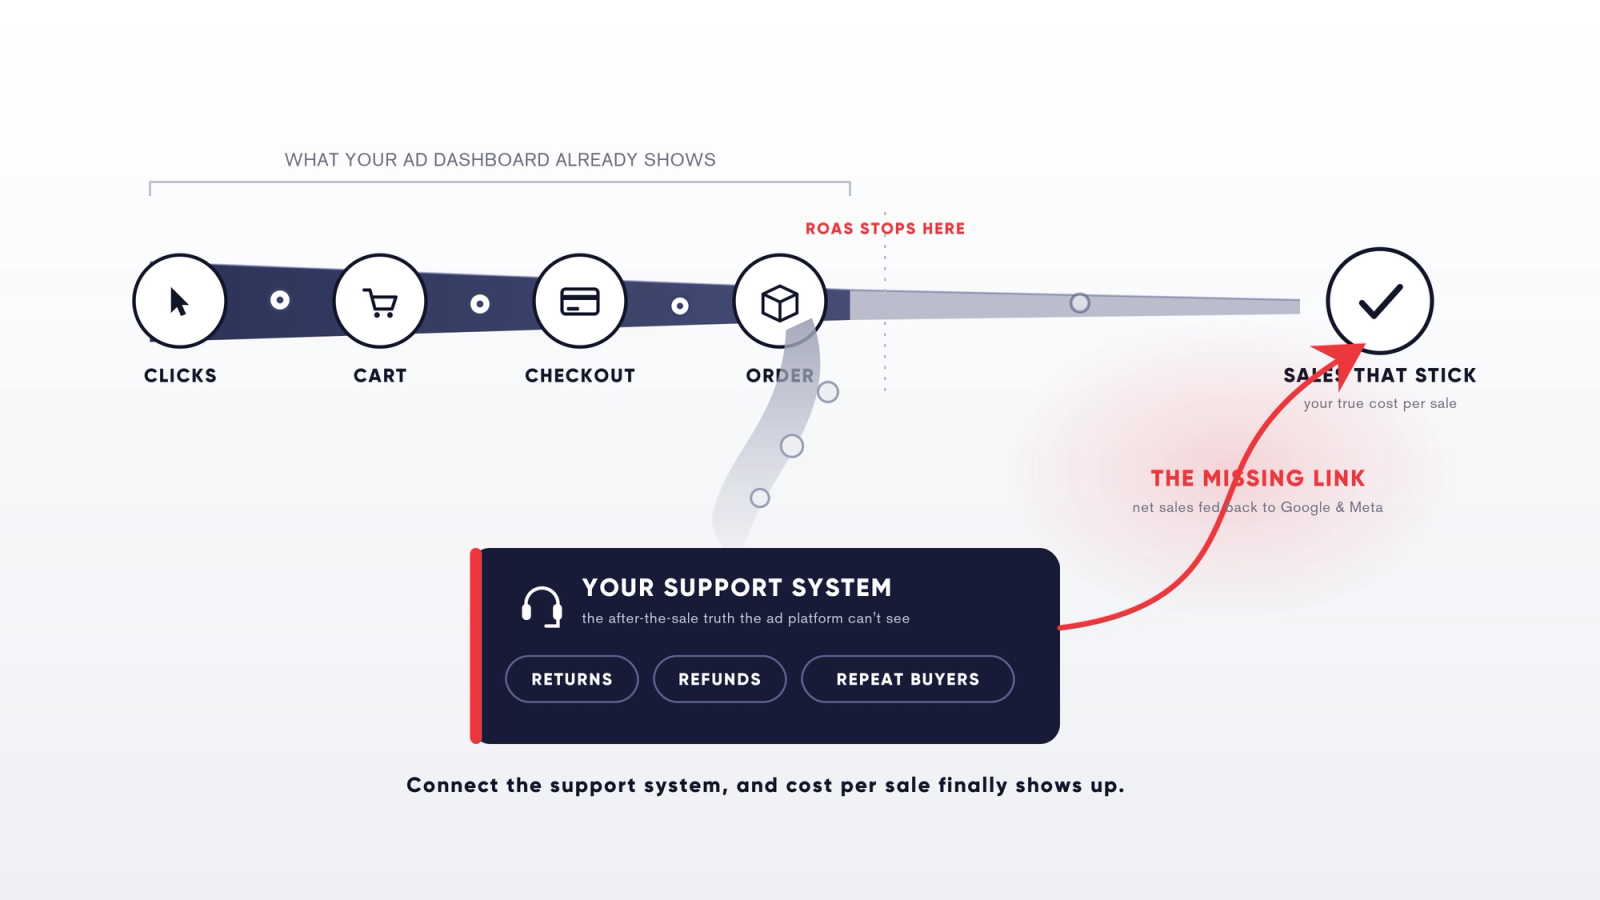
A click isn't revenue. A sale is, and a sale that sticks even more so. Between the click and the money sits a chain: a click becomes a visit, a visit becomes an add to cart, a cart becomes a checkout, a checkout becomes a paid order, and a paid order becomes revenue you actually keep once returns and refunds settle.
Cost per click measures the first link and ignores the rest. Even ROAS, the number most ecom teams graduate to, stops at the order. It counts the sale on the day it happens and never looks back at the half that came back in a returns box three weeks later.
So a campaign can look cheap on clicks, or strong on ROAS, while producing discount-hunters who buy once and refund often. Another can look expensive while quietly bringing in the customers who keep what they buy and come back.
A worked example: cost per sale vs cost per click
A hypothetical, to make the gap concrete. Two Meta campaigns, same store, one month. These are made-up numbers chosen to be tidy, not a client result.
Campaign A is broad prospecting on a discount hook. Spend $2,000, 400 clicks at $5, 80 orders. Cost per click looks great and ROAS reads 4x. The dashboard loves it.
Campaign B targets higher-intent shoppers at full price. Spend $2,000, 200 clicks at $10, 40 orders. Cost per click is double and ROAS reads 3x. On the chart, it's the weak one.
Now trace both past the checkout. Campaign A's discount buyers return 35% of orders and rarely reorder, so 80 orders become 52 kept, mostly on thin margins. Campaign B returns 8%, and a third buy again within the quarter, so 40 orders become 37 kept, at full margin.
Judged on ROAS, you'd pour budget into A and feel good doing it. Judged on cost per sale that sticks, B is the one building the business. Same ad account, same month, opposite decisions. That's what reporting on the wrong number does.
Why the dashboard stops at the click
Not malice, visibility. The platform optimizes toward what it can see, and its AI is very good at finding more of it. Point it at cheap clicks and it finds cheaper clicks. Point it at gross orders and it finds more orders, returns included. It's doing exactly what you asked, on half the story.
The usual advice at this point is to send your refund data back to the ad platform. Do that, it helps. But it only closes part of the gap, and the part it leaves open is bigger than most teams realise.
The half of the data nobody connects
Your ad platform knows what people clicked. Your store knows what they bought. Only your support system knows what they asked, why they sent it back, and what it cost you to serve them.
That third system almost never talks to the other two, and it holds most of what actually explains a campaign.
Sales that never touch your checkout. A rising share of ecommerce closes inside a conversation. Someone clicks the ad, lands in WhatsApp or an Instagram DM, asks two questions, and your team completes the order by hand. Meta logs a click and no conversion. Your store logs an order with no source. That campaign reads dead on the chart and could be the best one you're running. No amount of pixel work fixes it, because the order record has no source to correct. The conversation is the only place the link exists.
Refund reasons, not refund rates. Your store tells you an order was refunded. Your support inbox tells you the size ran small, or it arrived two weeks late, or it looked nothing like the ad. Group refund reasons by campaign and you learn whether the problem is the audience, the creative, or the courier. One of those means pause the campaign. The other two mean fix something and keep spending. ROAS can't tell you which.
What each campaign costs you to serve. Eighty orders that generate sixty tickets is a different business from eighty orders that generate eight. Support time is a real cost per order, and it swings hard between campaigns, because different creative sets different expectations and attracts a different buyer. It never reaches the margin calculation, because it lives in a system finance never opens.
The demand you paid for and lost. Presale questions that never became orders. Do you ship here, is this authentic, do you have my size. That's demand your ads bought and your site failed to serve, and it appears in no report anywhere. It's sitting in the inbox as a closed ticket.
What to actually build (three links)
Three links, and the third is the one everyone skips.
Tag the source on every order. Which campaign, which channel did this buyer come from? UTM parameters carried through to the order record, not dropped at the checkout redirect.
Carry the tag through to what happened after. Refunds, returns, reorders. The source rides along, so you can join spend to net revenue instead of gross.
Connect the support system to both. Tickets tagged to the order, the order tagged to the campaign. Once those three are joined you can answer questions no ad dashboard will ever answer: which campaign brings the customers who need the most help, which creative is driving the returns, which channel is quietly closing sales in the DMs.
Then feed the real outcome back. Send net sales to Google and Meta as offline conversions rather than raw purchases. With support data in the join you can go further and define a good conversion as a kept order from a low-effort customer who bought again. Both platforms accept the signal today. Almost nobody sends anything better than gross orders.
This is configuration work, not a rebuild. Once it's wired, it runs by itself.
The one question
Ask your team this week: which campaigns generate the most support tickets, and what are those tickets about?
If nobody can answer, you're making budget decisions on half the evidence. A good ads partner will tell you they need order and returns data to close the loop, and help build it. Keep them. If the answer is a better-looking ROAS chart, that's told you something too.
The other half of the answer is already sitting in your support inbox. You've collected it, you've paid for it, and it isn't touching a single decision you make about ad spend.
Common questions
Cost per click is what you pay for a visit. Cost per sale is what you pay for an order that actually completes. The gap between them is your conversion rate, and the gap between cost per sale and profitable cost per sale is your return rate, your margin, and what it cost your team to serve that customer.
No. ROAS measures revenue against ad spend, and revenue isn't profit. A campaign can post a strong ROAS while selling discounted stock at thin margin that comes back as returns. Average ecommerce ROAS sat around 2.87:1 in 2026 across published benchmarks, but the number on its own tells you nothing without margin and returns beside it.
Click-to-message ads have no landing page for the pixel to fire on, so Meta records that a conversation started and nothing after that. If your team completes the order by hand, your store has an order with no campaign source and Meta has a click with no conversion. The link only exists in the conversation record, which is why the fix runs through your support system rather than your pixel.
Four things: which sales closed inside a conversation and never got attributed, why orders came back rather than just how many, what each campaign costs your team to serve, and what presale questions your ads paid for that never became orders. None of that exists in an ad platform or a store dashboard.
Yes. Both accept offline conversion uploads today, so you can report net sales instead of raw purchases and let the bidding optimise against revenue you keep. Most teams never send anything better than gross orders.