Two or three weeks before the month closes, you already know whether you're landing above or below budget. Not a feeling. A number, and enough time to do something about it.
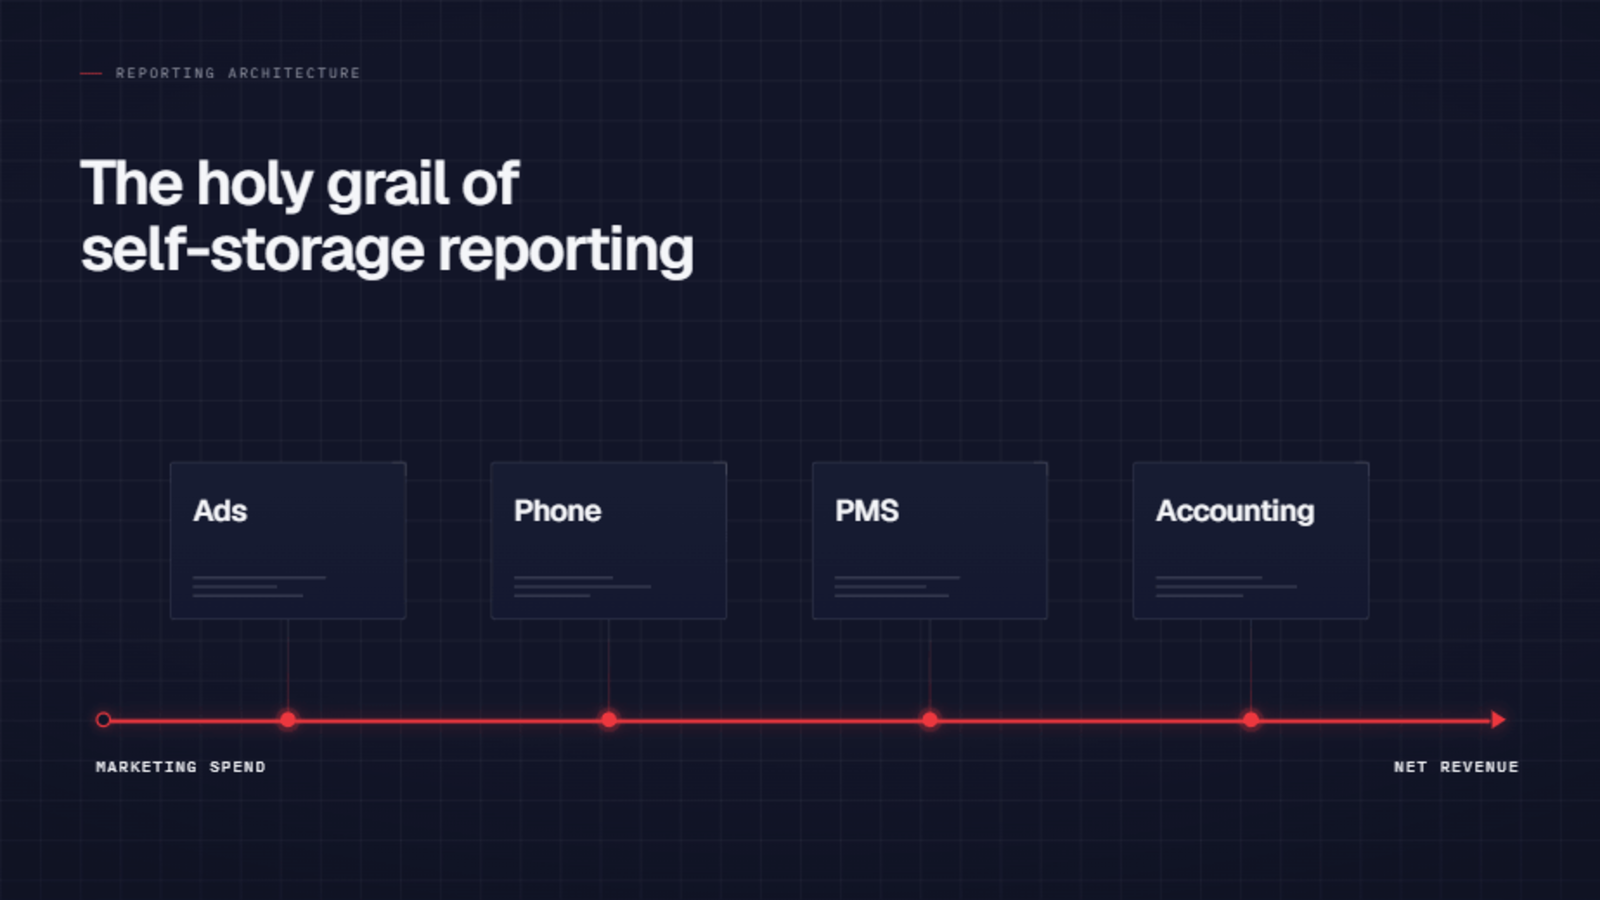
That's what the holy grail of self-storage reporting gets you: a single connected line from marketing spend to net revenue. Marketing data to leads to move-ins to move-outs to net revenue, in one view, updated as the month runs. Operators have all of the pieces - the PMS, the phone system, the ad platform, the accounting system - but the pieces don't talk, so the line never gets drawn.
I built it once in 24 years. I'm rebuilding it now for my own storage business. This post is the architecture - what connects to what, where it breaks, and where to start.
The connected line
The line is one funnel with five numbers: website visitors, leads, move-ins, length of stay, net revenue.
The mechanism is not per-click tracing. It's the rates between those numbers, watched long enough to trust them. Say 100,000 visitors a month convert to leads at 1%. That's 1,000 leads. Roughly half become move-ins. Average length of stay is 18 months, which means you replace your entire customer base every 18 months. Multiply through and you have next quarter's revenue sitting in this month's funnel.
Once the rates hold steady, the levers appear. In our case: spend 10% more on marketing in the right season, get roughly 3% more net revenue. Not a formula from a textbook. A relationship we observed in our own data until we could plan against it.
Why only 3%? Because revenue is a stock and move-ins are a flow. Marketing moves the flow, and the flow moves the stock slowly. This month's revenue is mostly last quarter's move-ins, already banked. That's also why the line lets you see ahead - two or three weeks out, you know whether you're landing above or below budget, while there's still time to do something about it.
If your reporting can't do that, you don't have reporting. You have four dashboards and a gut feeling.
Where the line breaks
The data lives in four systems that don't talk - the PMS, the phone system, the ad platform, the accounting system. Connecting them is plumbing work, and the plumbing fails at three specific joints.
Spend to leads. Attribution is decided at intake, by infrastructure. It cannot be reconstructed later. Twenty years ago we ran fifty phone numbers - a different number for each ad, each channel, each building - so every call carried its source with it. Today you'd use UTMs, tracking numbers per campaign, offline conversion feeds. Better tools, same principle: if the source isn't captured the moment the prospect makes contact, it's gone forever.
Leads to move-ins. This joint breaks on definitions, not plumbing. A lead is the first unique contact from a prospect with storage intent - a call, an email, a chat asking about a unit. "What time do you open" is not a lead. And a lead needs a timer: the same person coming back inside 90 days is the same lead; coming back after 90 days is a new one. Without the definition and the window, your conversion rate is fiction, and everything downstream inherits the fiction.
Move-ins to net revenue. The PMS is the source of truth, and net revenue is the number. Two rules keep it honest. Move-in promotions get excluded - they're a marketing expense dressed as a discount, and counting them as revenue erosion misstates both marketing cost and revenue. Ongoing discounts stay in, because they're real. Length of stay is the multiplier that turns a move-in into a forecast - it's the difference between counting wins and predicting revenue.
The part the plumbing doesn't solve
Attribution used to be the hard problem. Tooling has caught up on most of it. Seasonality hasn't been solved by anyone's tooling, because it's domain knowledge, not data engineering.
In mature markets, you know the pattern and build it into the model. The UK: summer busy, winter slow. Japan: moving season kicks up late February through April as students and company transfers relocate, a wave of move-outs follows in late April and May as the short-stay movers clear out, then a smaller spike in August and September. A model that knows this reads a slow February in the UK as normal and a slow August as a problem.
In new markets, the knowledge doesn't exist yet. I'm building storage in Indonesia and I cannot tell you what busy season is. Nobody can. You earn that answer by running the line and watching your own data until the pattern shows itself.
That's the general rule: the trends are yours alone. The marketing-to-revenue relationship for a 20-site operator in the UK is not the relationship for a single site in a university town. You have to earn your own numbers.
Where to start
Not with attribution software. Earn your funnel rates first.
You don't need per-click attribution to build the line. Aggregate rates - visitors to leads, leads to move-ins, average length of stay - get you the forecast and the lever. Attribution is the optimization layer on top: it tells you which campaign deserves the extra 10%, not whether the extra 10% works.
But capture attribution at intake from day one anyway, even if you won't use it for a year. It's the one thing on this list you can't backfill. A report can be rebuilt anytime. A phone call that arrived last March with no source attached is gone.
I don't have the rebuild finished. When I do, I'll write up how it flows end to end.
If you've built something like this, or tried and hit a wall, I'd like to compare notes - particularly on attribution and how you handled the seasonal swings.
Common questions
A single connected line from marketing spend to net revenue: marketing data to leads to move-ins to length of stay to net revenue, in one view, updated as the month runs. Most operators own every piece already (PMS, phone system, ad platform, accounting) but the systems don't talk, so the line never gets drawn.
Watch the rates between five numbers: visitors, leads, move-ins, length of stay, net revenue. Once those rates hold steady, this month's funnel already contains next quarter's revenue. Example: 100,000 visitors at a 1% lead rate is 1,000 leads, roughly half convert to move-ins, and an 18-month average stay tells you how long each move-in pays out. Multiply through and the forecast is sitting in front of you.
Because revenue is a stock and move-ins are a flow. Marketing moves the flow, and the flow moves the stock slowly. This month's revenue is mostly last quarter's move-ins, already banked. New spend takes a full stay cycle to show its full effect. The 3% figure is a relationship you observe in your own data, not a formula.
The first unique contact from a prospect with storage intent: a call, email, or chat asking about a unit. "What time do you open" is not a lead. A lead also needs a timer. The same person returning inside 90 days is the same lead; after 90 days they're a new one. Without that definition and window, your conversion rate is fiction.
Attribution is decided at intake, by infrastructure, and it cannot be reconstructed later. Capture the source the moment the prospect makes contact using UTMs, per-campaign tracking numbers, and offline conversion feeds. If the source isn't captured at first contact, it's gone forever. A report can be rebuilt anytime; a call that arrived with no source attached can't.
No. Move-in promotions are a marketing expense dressed as a discount, so counting them as revenue erosion misstates both marketing cost and revenue. Exclude them. Ongoing discounts stay in, because they're real reductions to what a tenant pays.
Not with attribution software. Earn your funnel rates first: visitors to leads, leads to move-ins, average length of stay. Aggregate rates give you the forecast and the main lever. Attribution is the optimization layer on top, telling you which campaign deserves more budget. Capture attribution at intake from day one anyway, because it's the one thing you can't backfill.
The structure transfers; the numbers don't. The marketing-to-revenue relationship for a 20-site UK operator isn't the same as a single site in a university town. Seasonality especially is domain knowledge, not data engineering. In new markets like Indonesia, nobody knows the busy season yet. You earn that answer by running the line and watching your own data until the pattern shows itself.