A Swiss watch isn't precise because of any single part. It's precise because every part is connected, calibrated, and moving in time with the others. Take one gear out of sync and the whole thing drifts.
Most self-storage operations don't drift because the data is missing. They drift because the data isn't connected.
The dashboard that looks fine
Occupancy is up. Revenue is up. The monthly dashboard looks healthy. And then rates start slipping, move-outs tick up, and no one can quite explain why.
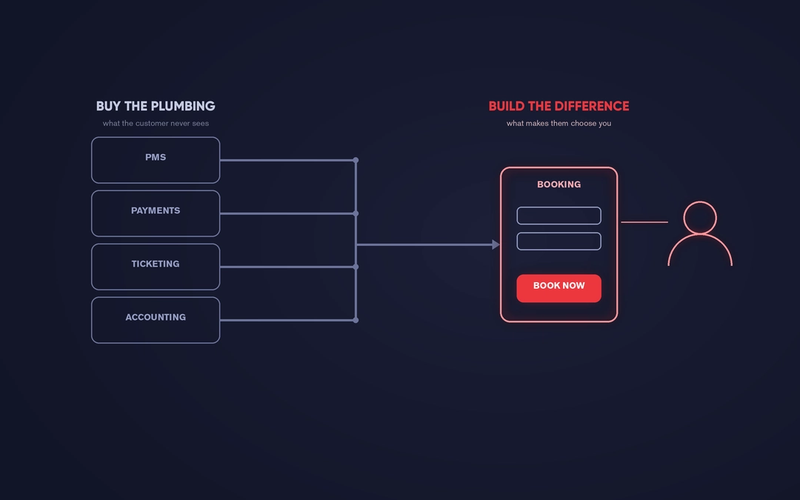
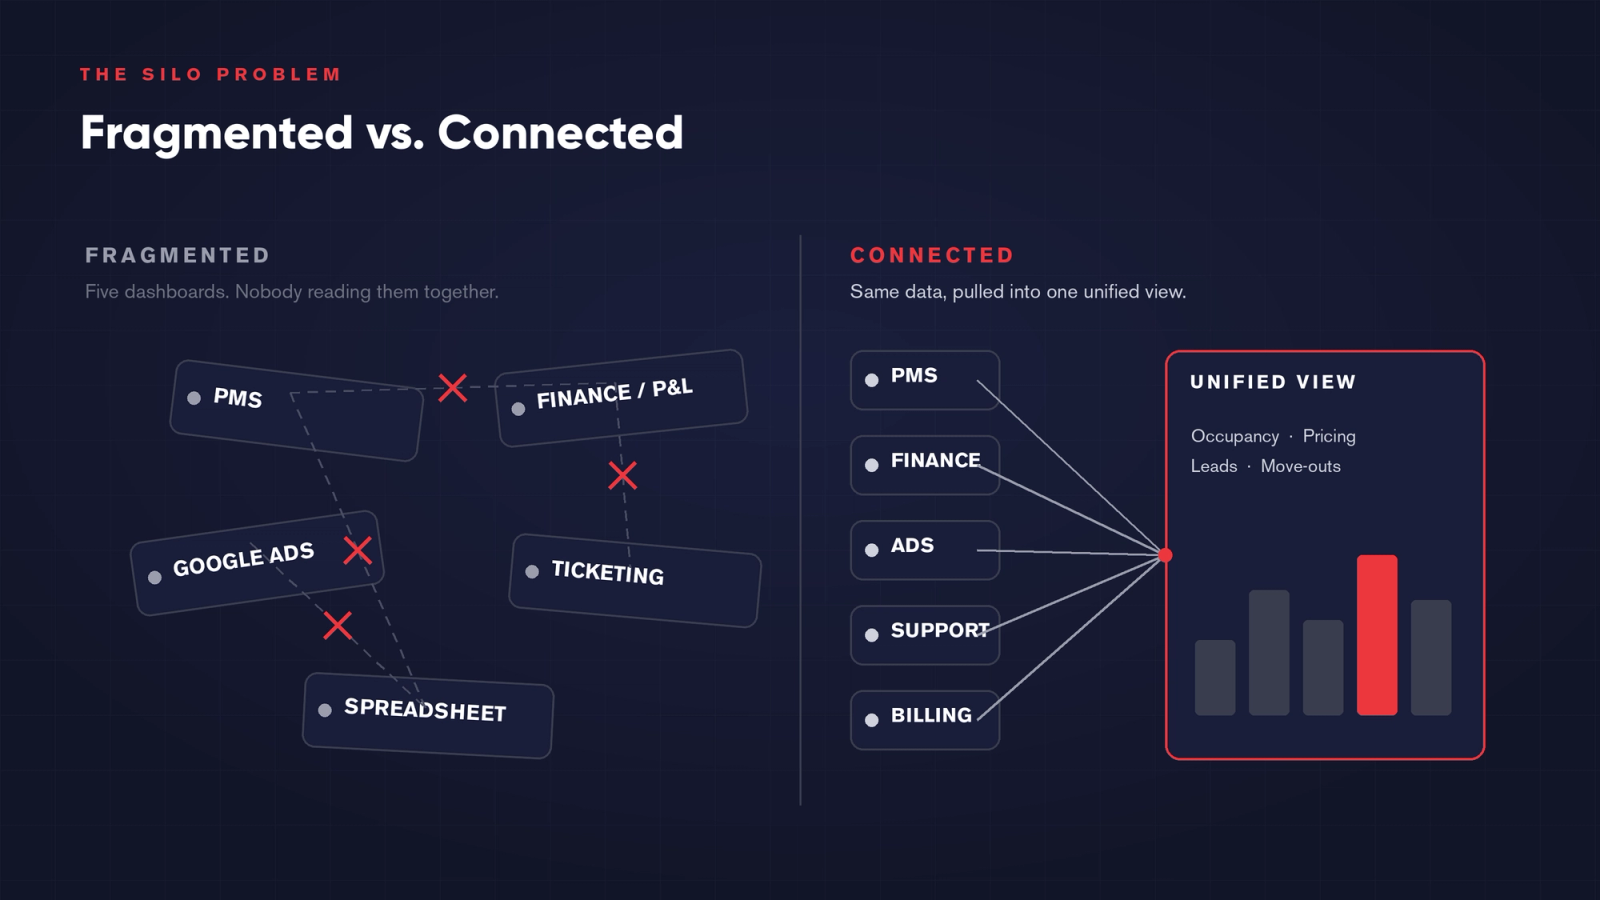
It's not that operators don't measure. They measure constantly. The PMS reports occupancy. The accountant produces a P&L. The ad platform has its own dashboard. Customer enquiries sit in a ticketing tool or an inbox. Somewhere there's a spreadsheet stitching a few of these together — last updated a quarter ago.
Each source is accurate on its own. The problem is that no one is reading them together. Decisions get made on a single chapter of a much longer story.
Data hygiene is a competitive moat
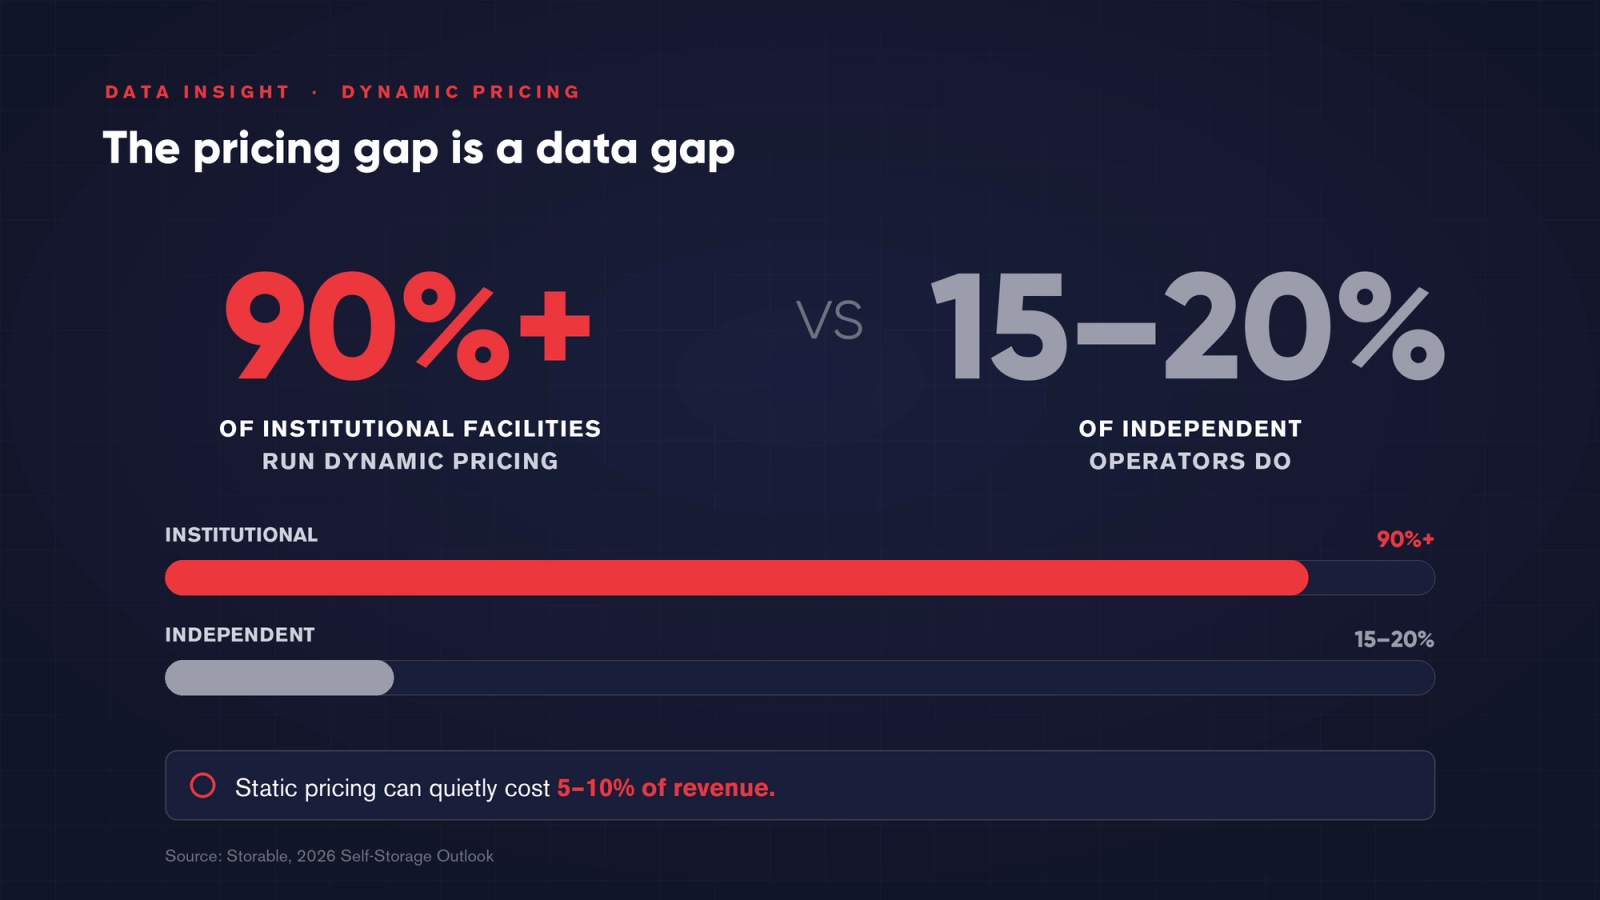
The gap between operators is widening, and it's increasingly a data gap. More than 90% of institutional facilities now run dynamic pricing; among independents it's closer to 15–20% — and static pricing can quietly cost 5–10% of revenue (Storable, 2026 Self-Storage Outlook).
Pricing is just the visible edge. The operators pulling ahead treat connected, clean data as infrastructure — the thing every other decision rests on. It's unglamorous, and it's exactly why it's a moat: most competitors won't do the boring work of getting their data to talk.
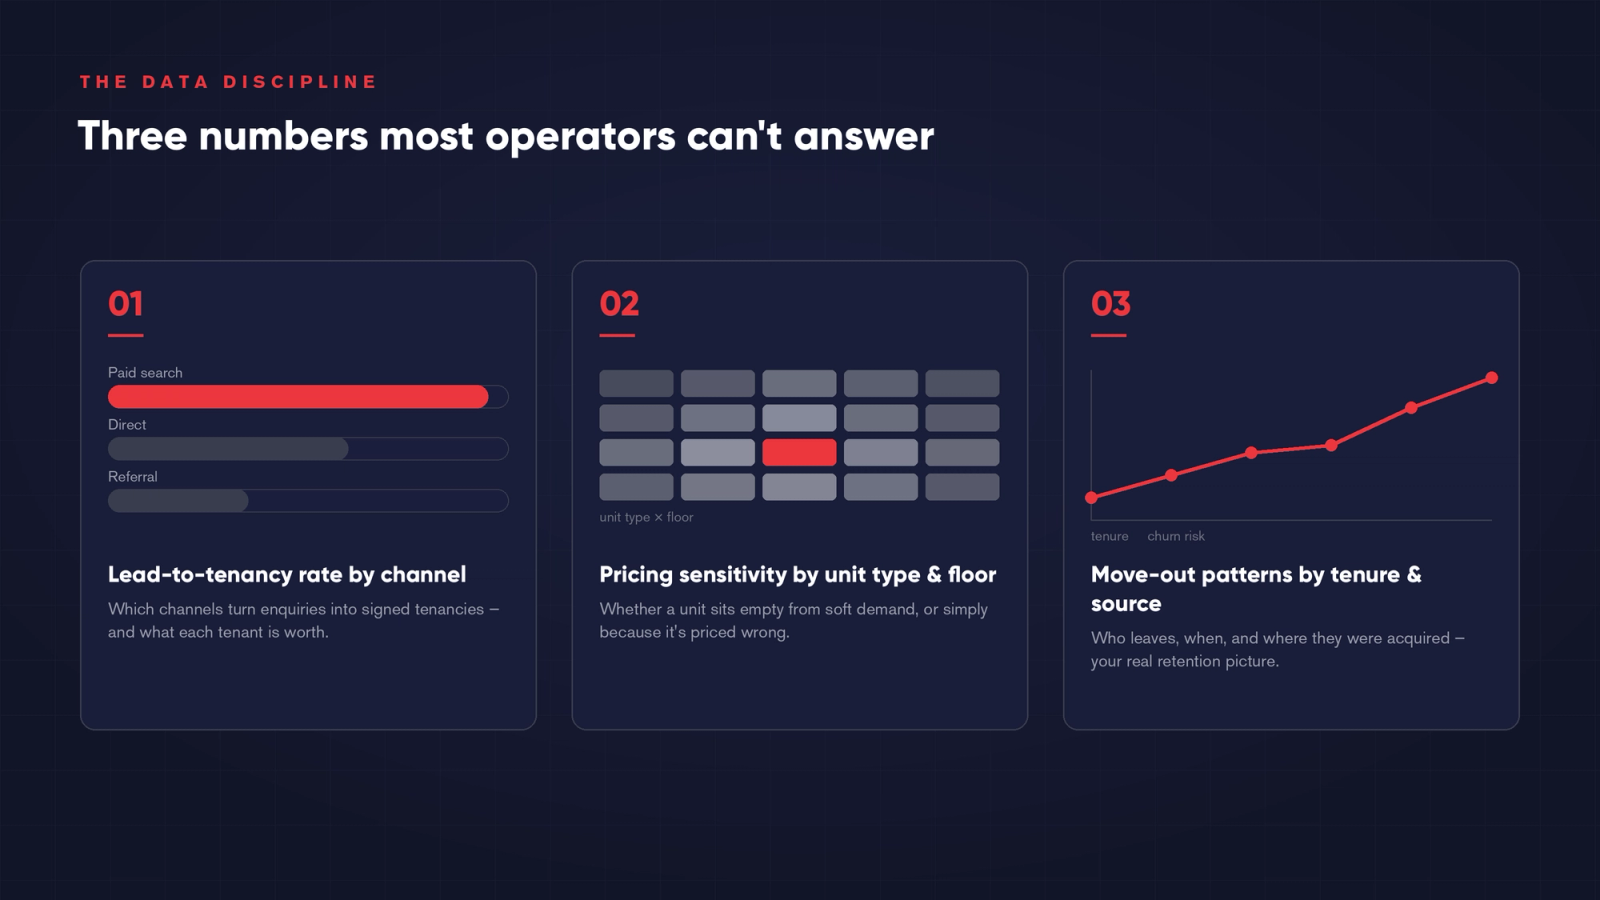
The three numbers most operators can't answer
Connected data surfaces questions a fragmented stack simply can't:
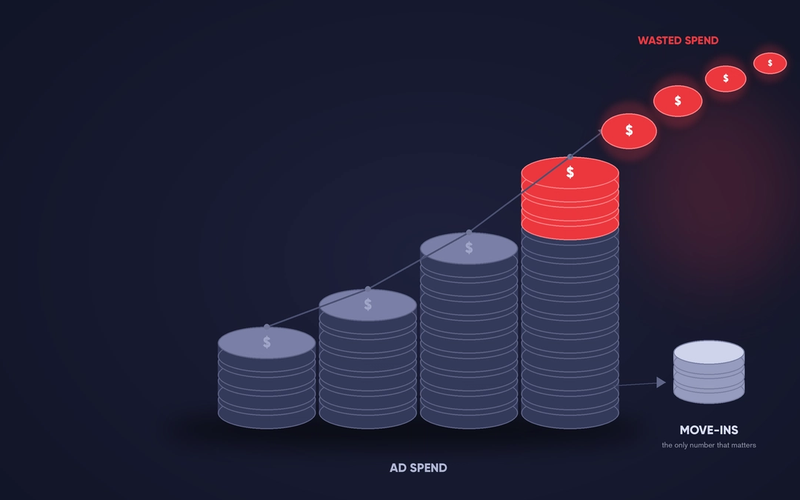
Lead-to-tenancy rate by channel. Most operators know their enquiry volume. Far fewer know which channels actually convert into signed tenancies, at what rate, and what each tenant is worth over their stay. Without that, marketing spend is a guess.
Pricing sensitivity by unit type and floor. Some units sit empty because demand is soft. Others sit empty because they're simply priced wrong — and you can't tell the difference without cross-referencing occupancy against pricing history.
Move-out patterns by tenure and acquisition source. A tenant who arrived via paid search behaves differently from a direct walk-in. Knowing who leaves, when, and where they came from tells you where your real retention problem lives — not where you assume it is.
Do this before you touch AI
Every operator excited about AI wants to apply it now. But AI sitting on dirty, fragmented data doesn't produce insight — it produces confident nonsense, faster. A model that can't see your true lead-to-tenancy picture will optimise toward the wrong thing with total conviction.
Clean, connected data first. Then the AI you layer on top has something true to work with.
Where to start
None of this requires a heavyweight platform. It requires the data you already hold — PMS, ad platforms, billing, support — pulled into one place, cleaned, and structured so it can be read together. Power BI, Zoho Analytics, or a well-built model will do the job. The barrier was never the tools. It was getting the data out of its silos.
Get the parts moving in time with each other, and the operation starts to run like the watch — quietly precise, and a lot harder for a competitor to copy.
← Back to the blog